Portfolio Details
Project Information
- Category: System Monitoring and Visualization
- Client: Personal Project
- Project date: Ongoing
Home Lab Monitoring and Visualization
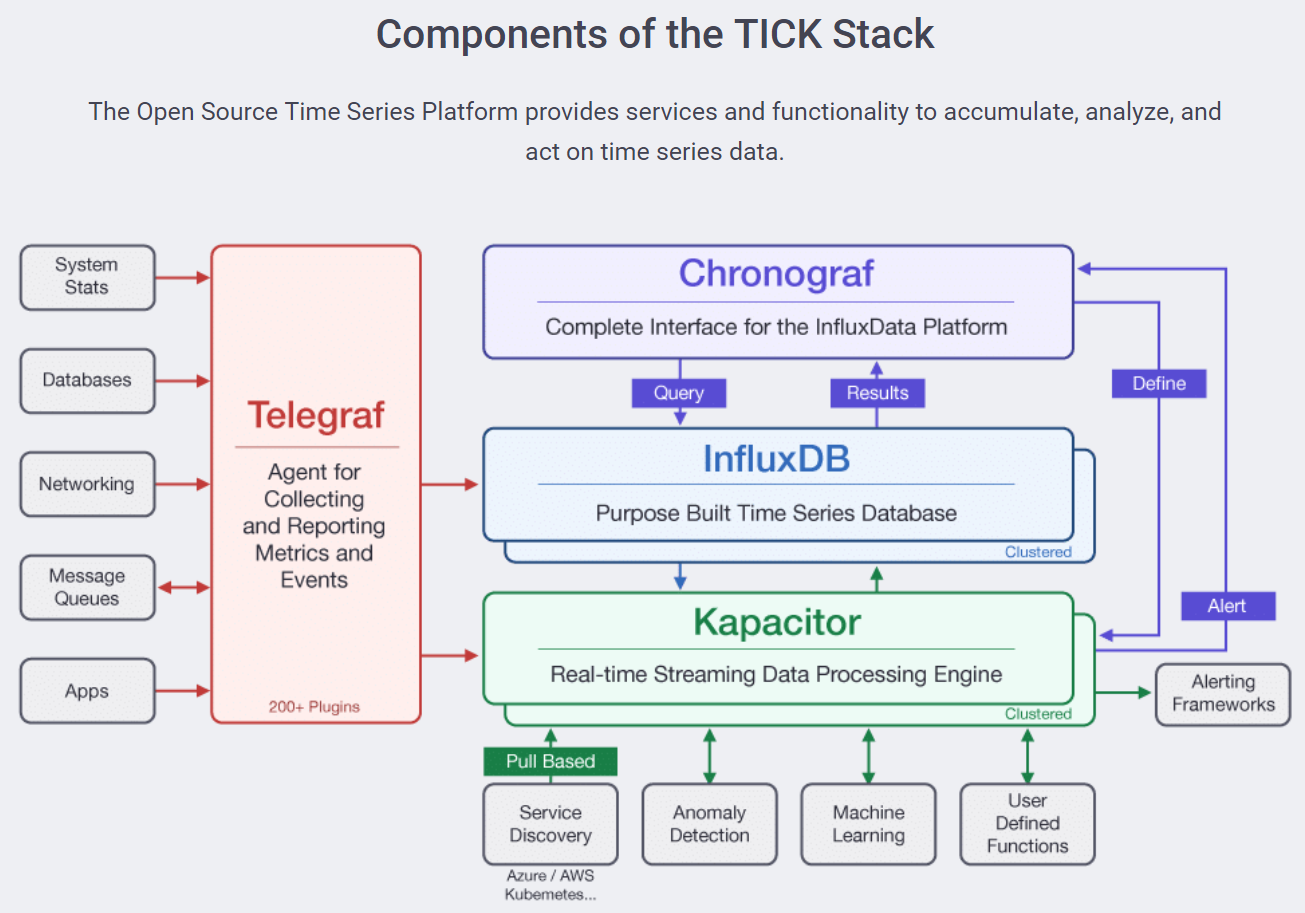
This project focuses on enhancing the monitoring and visualization capabilities of my home lab. By implementing the TICK stack (Telegraf, InfluxDB, Chronograf, Kapacitor) and Grafana, I can visualize operating system metrics and create alerts that are sent to a Discord server using webhooks. The process is streamlined using Ansible to deploy the correct configuration files per server, with GitLab CI/CD pipelines ensuring consistent and automated deployments.
The primary goals of this project include:
- Implementing the TICK stack to collect, store, visualize, and alert on OS metrics.
- Using Grafana for advanced visualization and dashboard creation.
- Setting up webhooks to send alerts to a Discord server for real-time notifications.
- Streamlining deployment with Ansible for consistent configuration management.
- Utilizing GitLab CI/CD pipelines to automate the deployment process.
The implementation involved the following steps:
First, I deployed Telegraf on all servers to collect metrics such as CPU usage, memory usage, disk I/O, and network statistics. These metrics are then sent to InfluxDB, a time-series database designed to handle high write and query loads. Chronograf is used for initial data exploration and dashboard creation, while Kapacitor handles alerting and data processing tasks.
Grafana is integrated with InfluxDB to create detailed and customizable dashboards. Grafana's powerful visualization capabilities allow for easy monitoring of system performance and trends over time. Alerts are created in Kapacitor, which processes the data and triggers webhooks that send notifications to a Discord server, ensuring I receive real-time updates on critical system events.
To ensure consistency and scalability, I used Ansible to manage the deployment of configuration files across all servers. Ansible playbooks were created to automate the installation and configuration of Telegraf, InfluxDB, Chronograf, Kapacitor, and Grafana. This approach eliminates manual configuration errors and saves time.
GitLab CI/CD pipelines were set up to further automate the deployment process. Whenever changes are made to the configuration files or playbooks, the pipelines automatically test and deploy the updates to the home lab environment. This ensures that the monitoring setup is always up-to-date and functioning correctly.
The benefits realized from this project include improved visibility into system performance, automated alerts for critical events, and a streamlined deployment process. The use of modern monitoring tools and automation practices highlights my ability to manage and optimize IT infrastructure effectively.


